Back to Project Based Learning Blogs
By: Trisha Burns, Middle School Facilitator
CSA Central-Columbus Signature Academy Middle School
Columbus, IN
As a math teacher, I feel the same pressure that other math teachers feel when it comes to high stakes, standardized testing. No, testing isn't the only thing that I focus on. I want my PBL students to develop employability skills such as critical thinking, communication, collaboration, and to have a growth mindset. However, similar to any other teacher, I have to focus on the math standards the state of Indiana says all eighth graders should know and will be tested on before the end of the year.
So starting back in the summer, when we begin to think about projects and planning, I knew that I wanted to review the critical standards (scatter plot, Pythagorean theorem, slope-intercept form, computation word problems) I had already taught students earlier this year and focus my time on solving equations standards. In science, it was time for the students to begin learning their chemistry standards. So after some brainstorming, we decided to do the project, It’s “Element”ary. This project was done last year as a science/English integrated project, so it needed to be adapted/modified to make it a math/science project. Last year students created lessons or “ learning experiences” for elementary students which had to relate to the “hot” topic they chose in their research. The English part of the project that we took out this year was an individual research paper on a current science topic in the news.
The problem the students defined at the beginning of the project was elementary teachers don’t always have the amount of time they would like to have to teach science in their classes. Most of the elementary day is focused on languages arts and math skills, which limits teachers from spending time implementing some of the interesting and fun aspects of teaching science. Mr. Paswater, a teacher at Taylorsville Elementary, sent the students a video where he discussed his daily schedule and some of his time limitations. Then after students discussed their memories of science, they decided they wanted to make sure elementary students got to experience the fun, educational science they remembered having as students. The students had to find ways to give these experiences outside the normal school day.
The students began to individually look through the Indiana standards for elementary science and completed a tournament bracket with their favorite standard in each grade level. After they had individually chosen their favorite standards, they took a survey on their top and second choice of topics. This is the process we used to choose groups. Their groups would need to design a 10-15 minute science lesson plan that would teach the students the science standard while giving the elementary students the best demonstration/learning experience for the topic they chose. For the complete solution criteria, you can check out our rubric.
As far as the content introduction, we had them play Periodic Table Scrabble. This helped them become familiar with how to read a periodic table and learn what the different symbols meant. I wanted to be able to add some math review to the worksheet so, I had them find percents of solids, liquids, gas, radioactive, and artificial substances. This helped them review how to find a percent to prepare them for the multi-step computation word problems, which are a critical standard for Indiana. Then after they created a word in the scrabble game, they used the Pythagorean Theorem to find the diagonal of the blocks they used to create their word. This wasn’t needed for the project at all, but it was a small place I found to review another critical standard.
While the students were creating group contracts and deciding what they wanted their “science experience” to look like for the elementary students, myself and the science facilitator separated content workshops. While the students were balancing chemical equations and learning the basics behind Chemistry in science class, we also reviewed and continued to build on our understanding of equations in math. So although the equations weren’t a direct necessity for the project’s final product, it was great for the students to see the similarities in the two classes through both the vocabulary and the steps to balance equations. In fact, I’m going to say that this was the first year that most students caught on and began using words like “coefficient,” “variable,” and “constant” while talking about solving equations in math.
Some groups knew from the very beginning what experience they wanted to develop; however, some groups needed more scaffolding. So we had those groups research the different options that would effectively teach the standard they had agreed to when we grouped them by their topic of interest. Then they created a decision matrix to decide what would be the best experience to teach the specific science standard. They decided that presenting science lessons with students in an after school program was the best option.
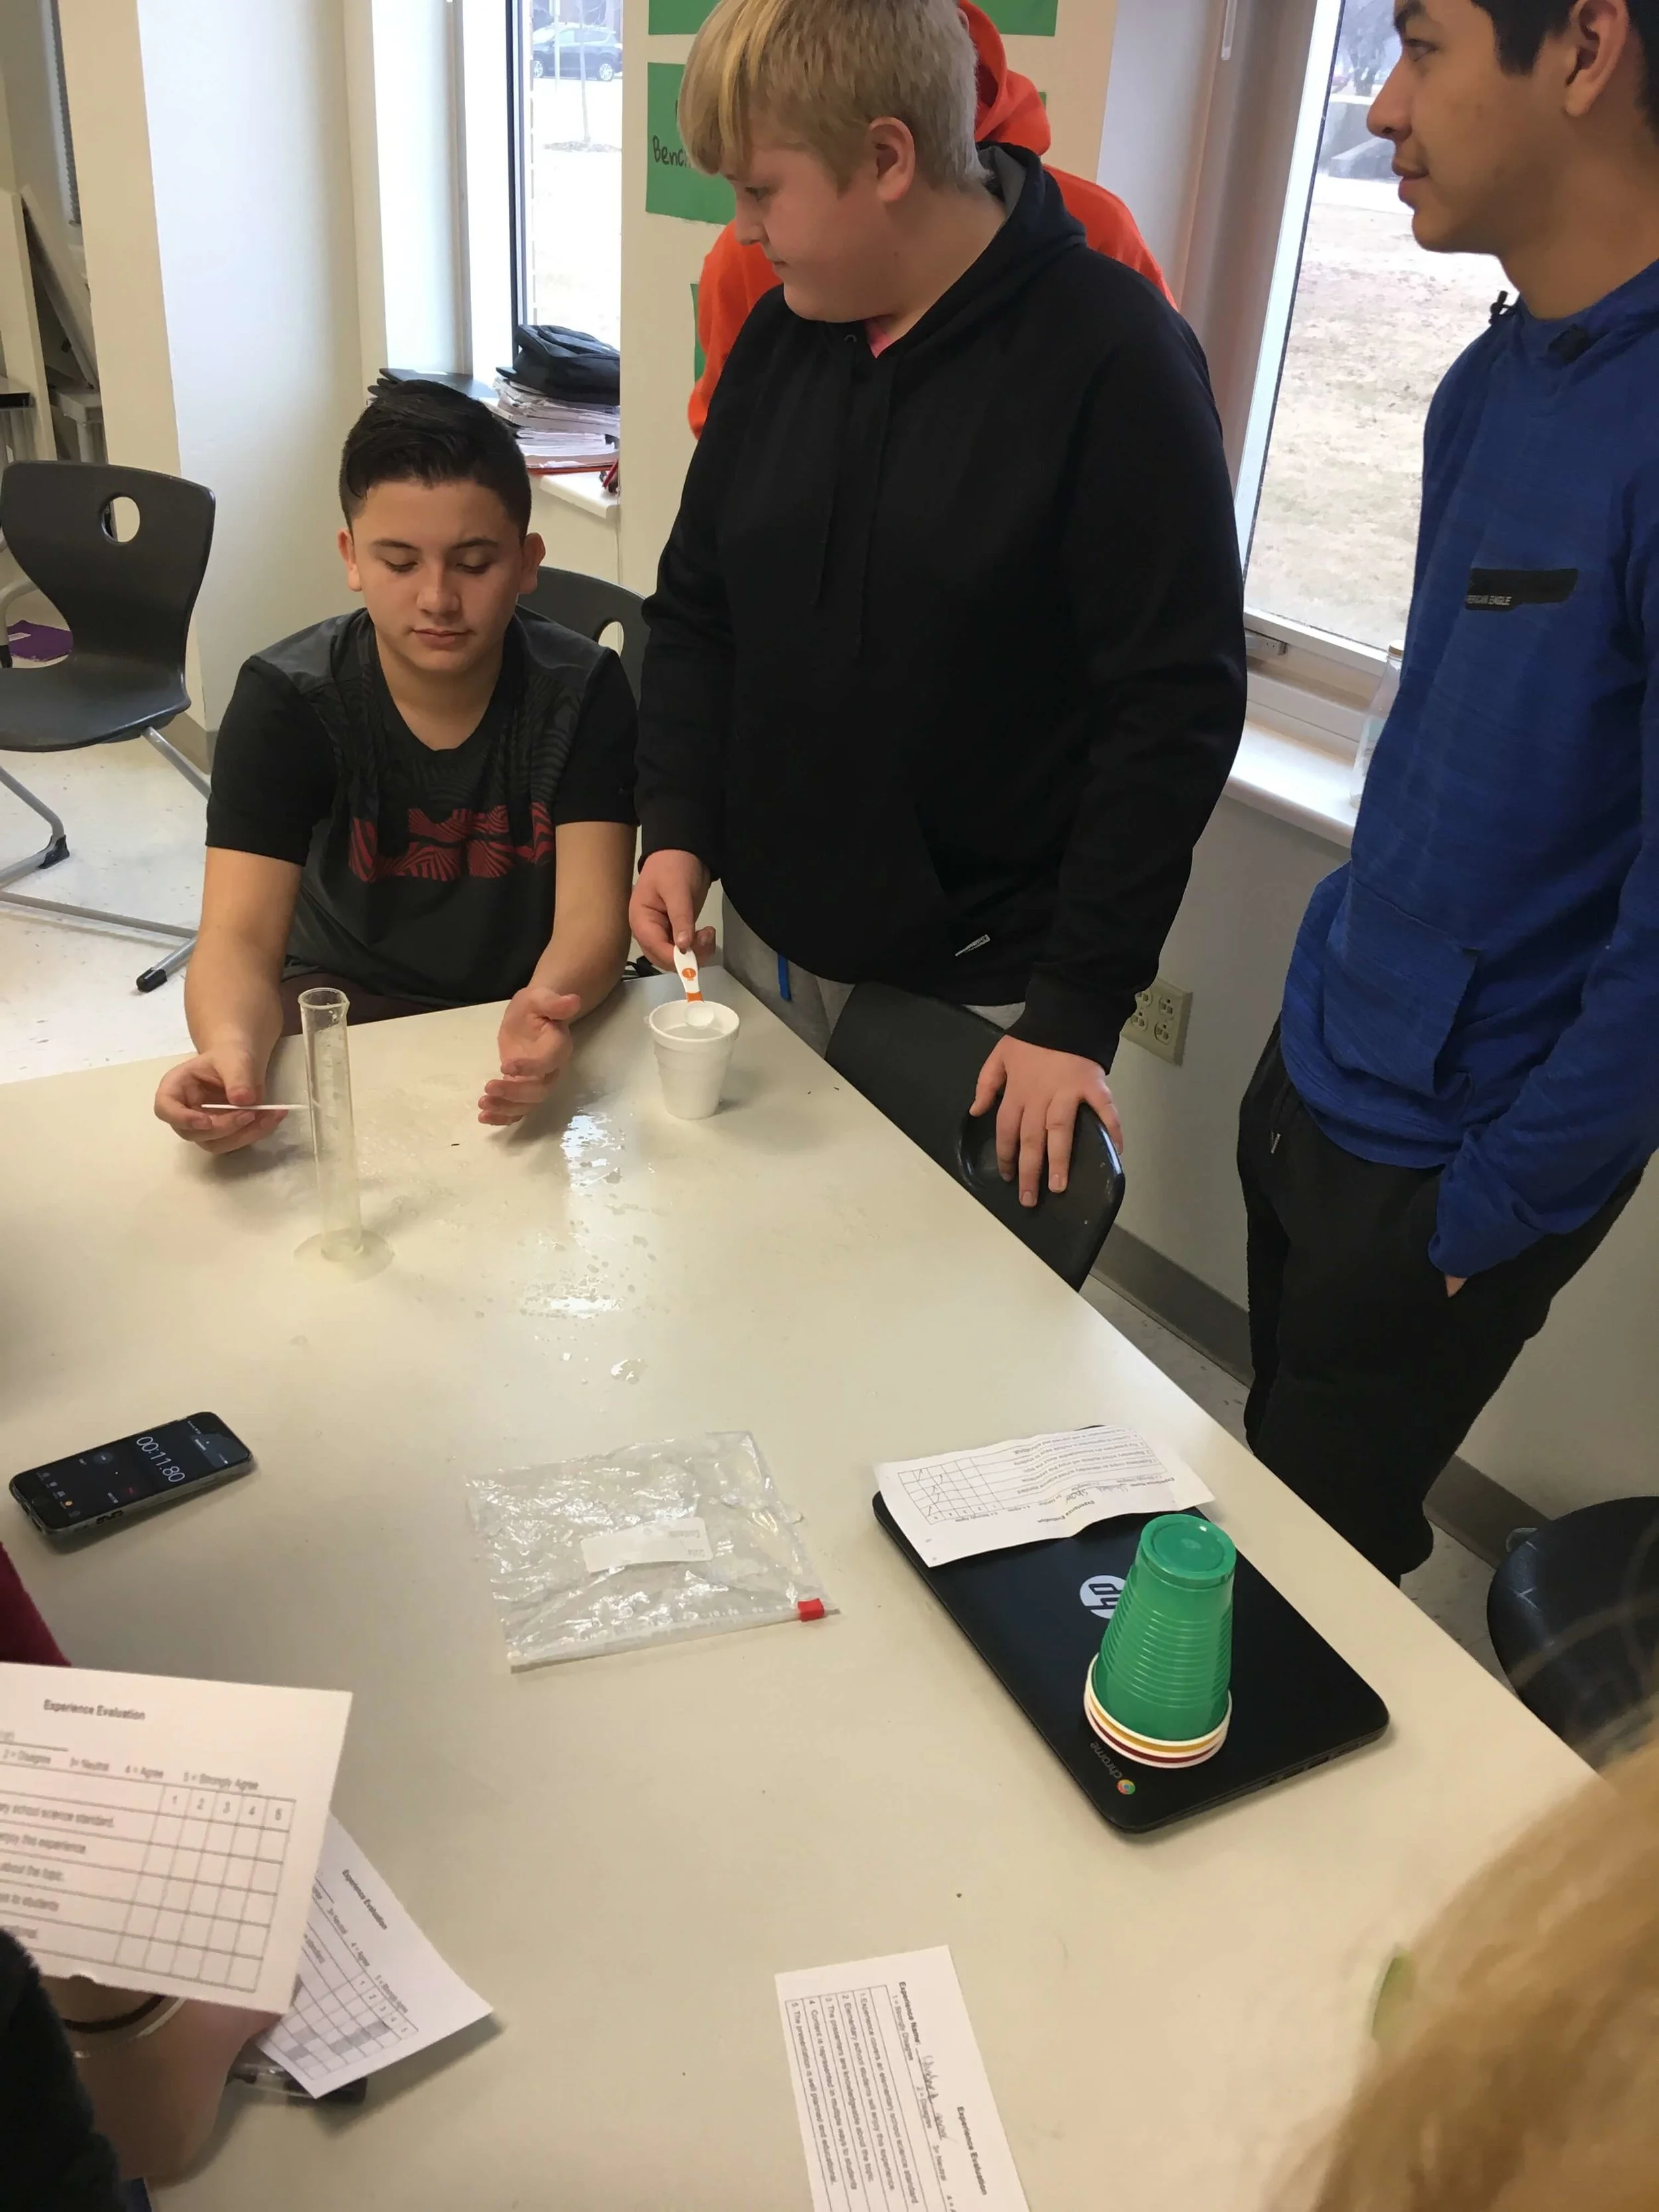
Part of their solution criteria for the project was to conduct an in-class experiment that created the BEST experience possible for the elementary students based on collected and analyzed data. The groups had to create a proposal for us to approve with their synopsis of what they wanted their experience to be and what experiment they were going to do in class to help create the best experience possible. This was a great review of their science experiment standards, which we had covered earlier in the year. Students thought of all kinds of experiments to do!
Presenting science lessons with students in an
after school program.
A couple of my favorites they came up with were to do a moon phase demonstration using Oreos. They experimented with how long different Oreos hold form when dipped in milk. They wanted to make sure they used the most durable Oreos when doing their moon phase demonstration for the elementary students. Others tested which parachute created the most drag for their remote control car. Another group measured the time it took for density cubes being dropped from different heights to sink in oobleck, a substance made of cornstarch and water. (Oobleck is an substance that acts like a liquid, and can be poured, but that acts like a solid when you apply force to it by pushing it or squeezing it.) They had to make sure their experiment would have two pieces of numerical data, so they could make a scatter plot, find a line of best fit, and make predictions based on graph. They learned their manipulated variable would become their independent variable and their responding variable would become their dependent variable. This was a perfect time for us to review how to graph a line, how to write an equation of a line of best fit, and how to use graphs to make predictions. Here is a sample of the math paper the students had to complete after their experiment.
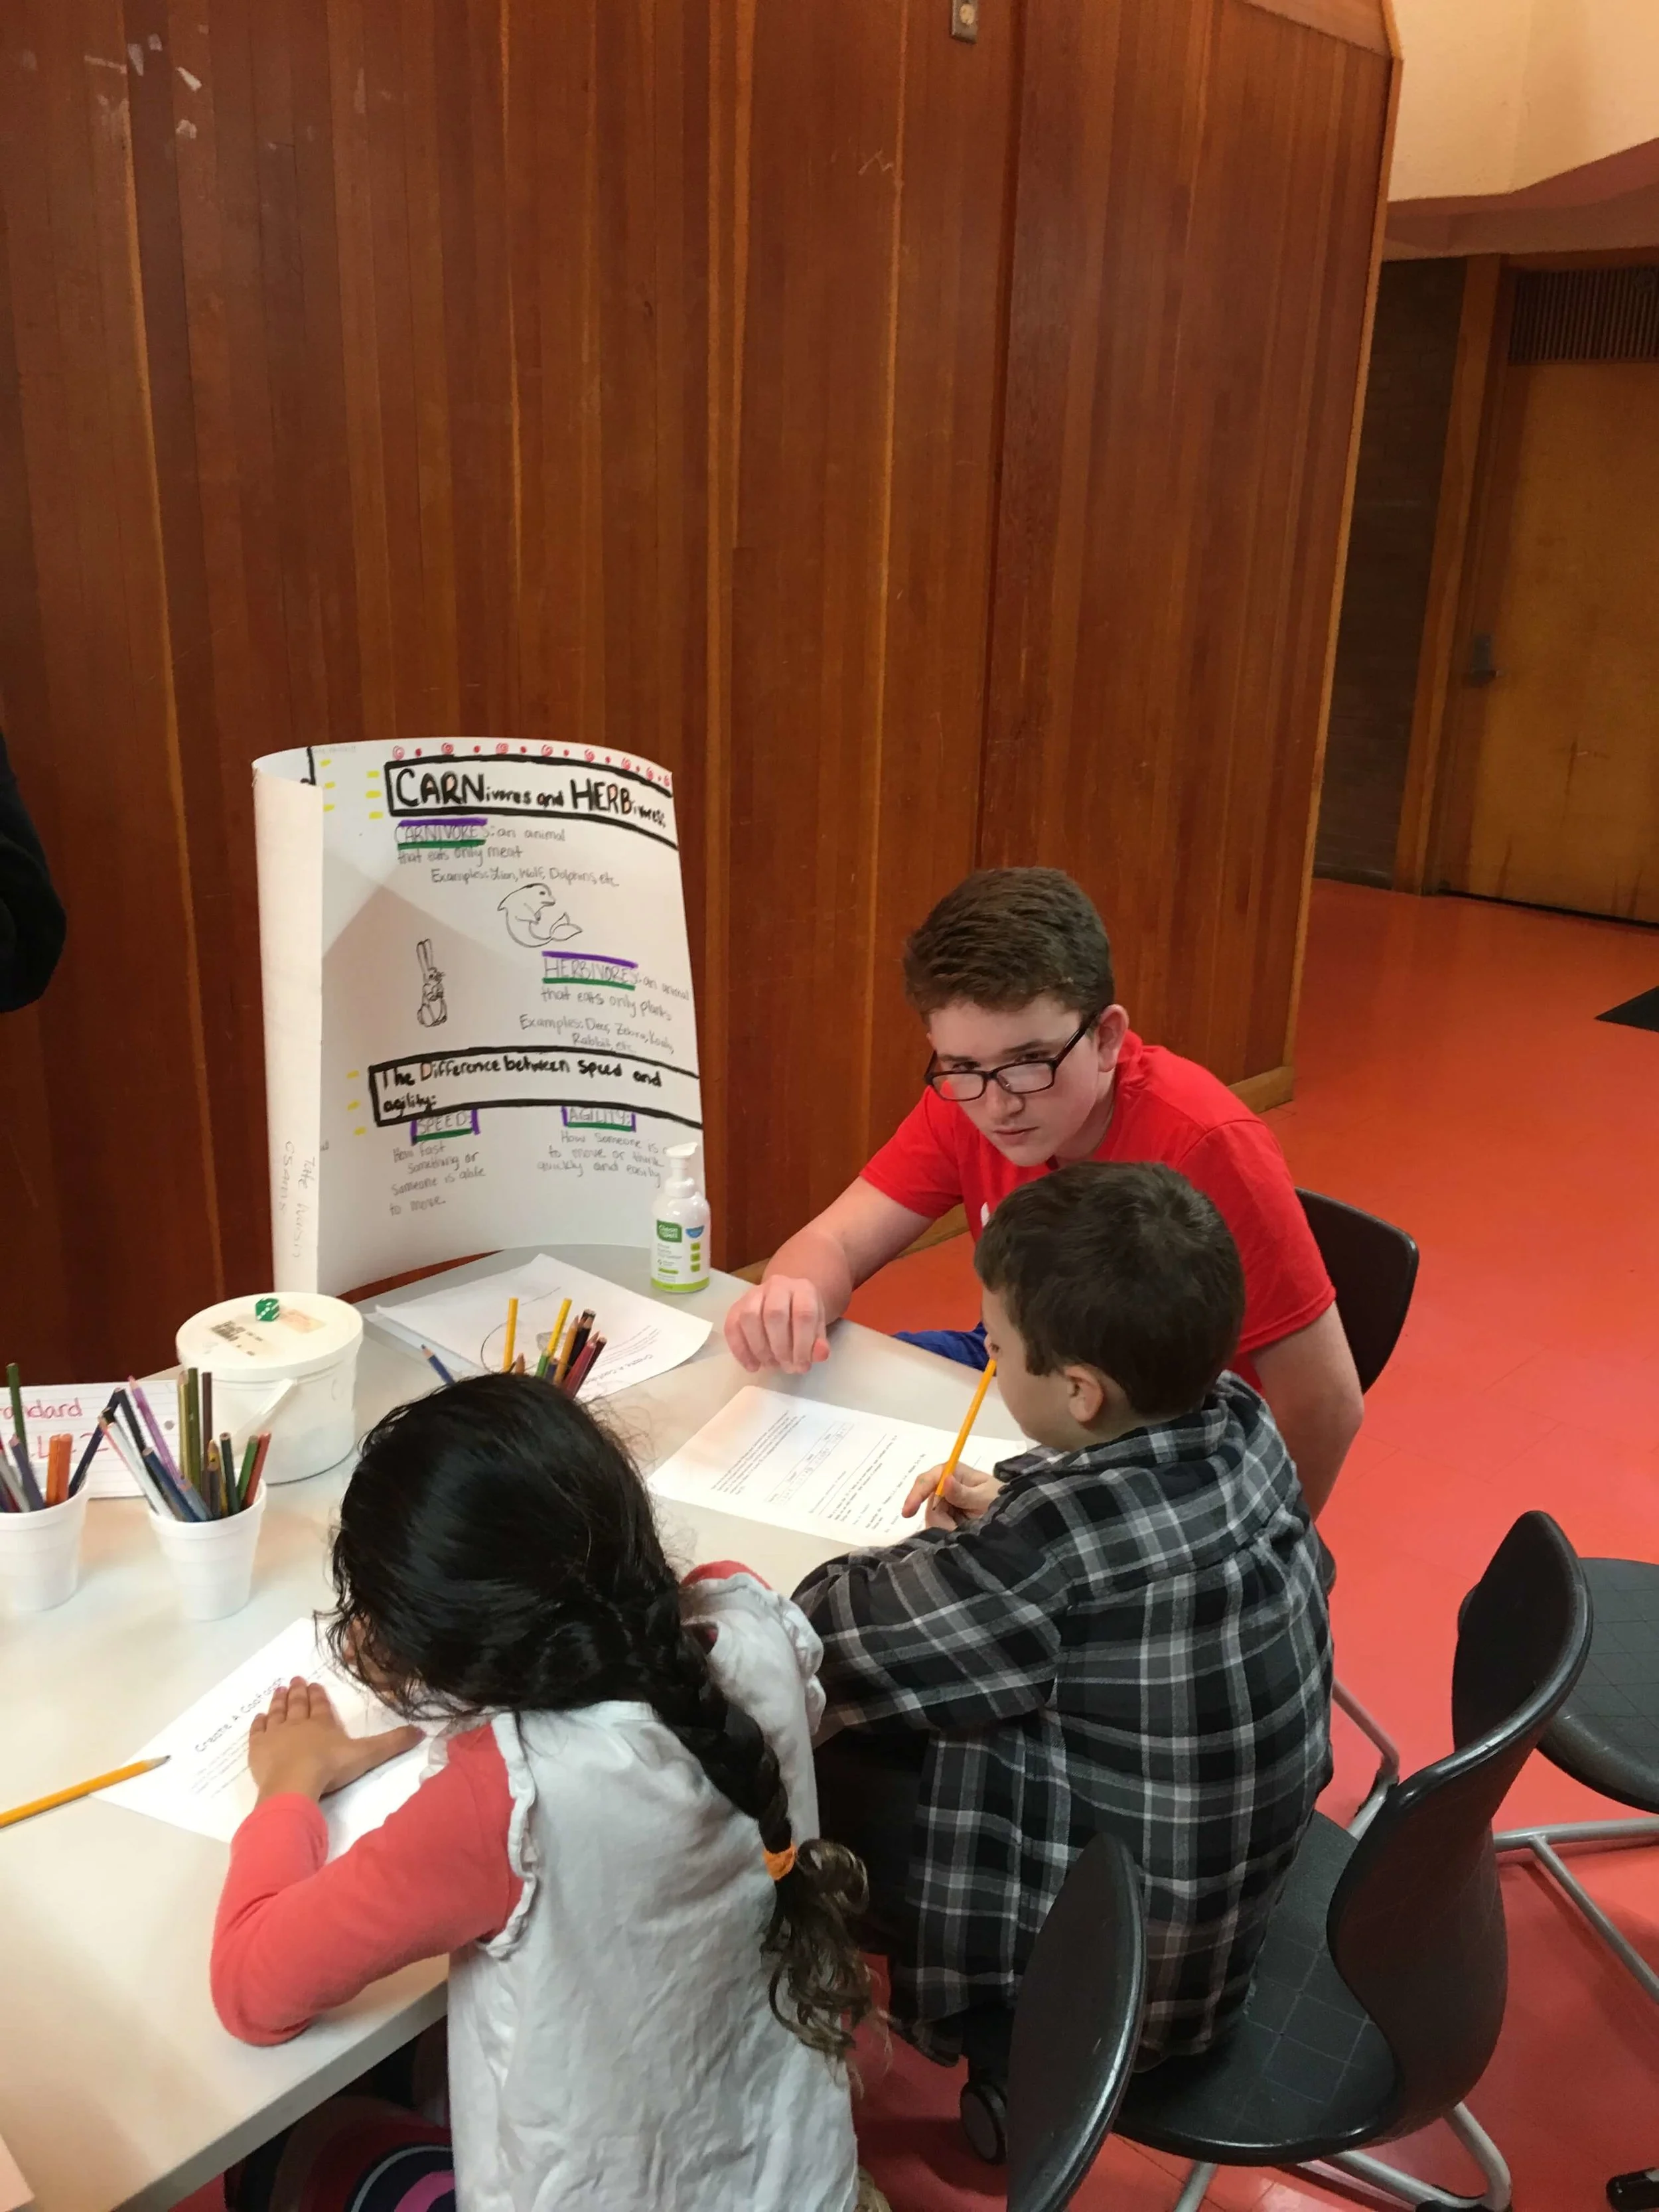
Focus groups testing out the science lessons.
During science workshops and while the students were conducting experiments, they worked on the chemistry behind their experience. Each group was required to complete a science paper by the end of the project about the chemical composition of the items utilized in their experience. They had to include items such as where the elements were found on periodic table, the number of protons, neutrons, and electrons, the electron configure model, the dot diagram and an ionic or covalent bonding drawing.
We use UDL (Universal Design for Learning) as our instructional framework in our district. We had a UDL facilitator for an elementary school in the district come give the students a crash course in teaching lessons to elementary students. The students had to brainstorm and then show evidence in their lesson plan as to “WHY” the information they were teaching the students was important to them as elementary students, “WHAT” they were going to teach (using multiple representations), and “HOW” the elementary students were going to be able to express that they learned what they were supposed to. While the UDL facilitator was there, she met with some groups and gave individual feedback on their lesson ideas.
Once the groups had created their lesson plans, and they were approved by either myself or the science teacher, they needed time to practice and teach their lessons in front of a focus group. We used 8th graders for some focus groups, but for some we used 6th grade students who came to our building to tour and see our program in action.
Focus groups testing out the science lessons.
The students had a choice on their community partner, so we had groups going at different times on different days. Since their final presentations for elementary students were so spread out (at almost a month between the first and the last group), we had plenty of content workshop times to continue to review and develop our skills needed to master the critical standards. In fact, to keep the theme of the project during content workshop days, I gave different groups of students different topics and had them create a 5 minute lesson plan to teach their math topic to the rest of the class using the principles of UDL they had learned in the project.
I figure before the end of this project, over 100 elementary students will have a data-driven experience that was designed by these 8th grade groups. Some groups went to the local Boys and Girls Club Friday night program to teach their science standard through an engaging experiment. Other groups went to an after school program at the neighboring elementary school. Other groups were able to go to the elementary school during the day to give their lesson and provide a science experience. I would say overall this project was a success since I know 100% of my students can confidently answer the driving question: How can we give elementary-aged students a data-driven, engaging science experience?
I often get asked how I find projects that connect to the math content that I teach. I wish I could say I have an idea for 100% of my content, but I don’t...yet. However, you just need to keep your eyes open! We tell our students that math is everywhere and that they will need it their whole lives. As math teachers, we need to believe this too. The math is there; we just need to find it!
*Blog originally posted on March 20, 2018
Trisha Burns is an 8th grade math facilitator at CSA Central Campus in Columbus, Indiana. She is a certified teacher and trainer through the New Tech Network and certified through Magnify Learning to teach Project Based Learning in Indiana. She has taught in the classroom since 2009 and facilitates for Magnify Learning in the summer. When she is not developing and implementing projects in her class room she loves to hang out with her family and scrapbook their memories!
SIGN UP TO RECEIVE OUR PROJECT BASED LEARNING BLOGS & RESOURCES!


